
When your child’s NAPLAN (National Assessment Program — Literacy and Numeracy) report comes home, it can look full of jargon, graphs, and unfamiliar terms. Rather than letting it cause confusion or stress, you can use it as a tool to understand your child’s strengths and growth opportunities. In this article, we unpack how NAPLAN results are reported, how to read them, and how to work with your child to make the most of them.
What Is Reported: The Key Components
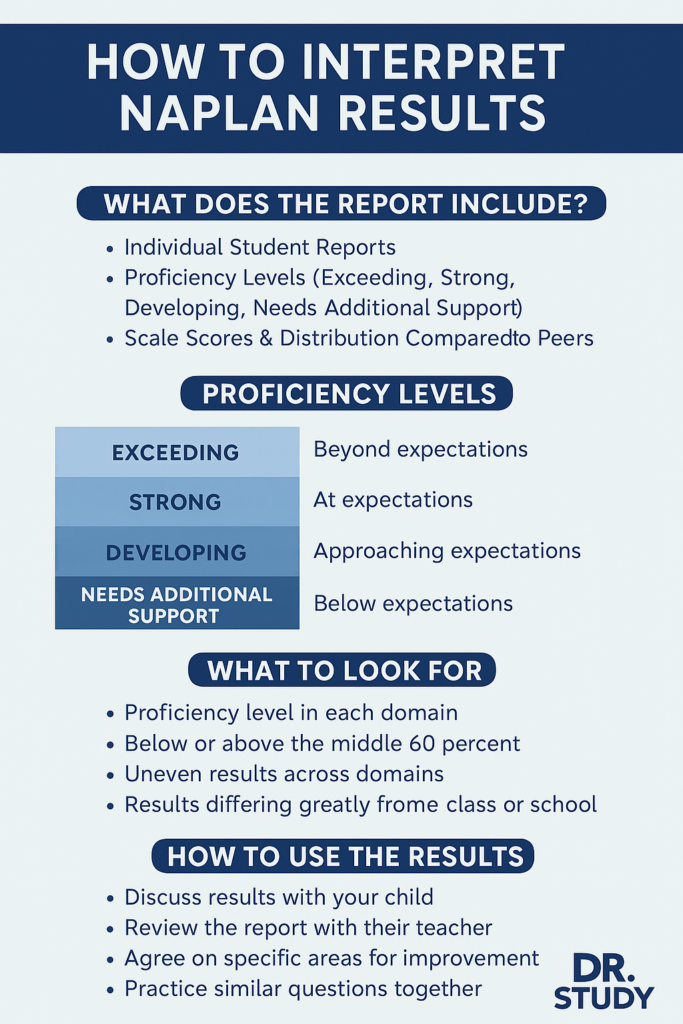
Your child’s NAPLAN report is part of a larger reporting framework. Below are the main pieces that schools and parents receive:
- Individual Student Report (ISR): This is the report you’ll usually get. It shows how your child performed in each domain (Reading, Writing, Conventions of Language / Grammar, Spelling, Numeracy).
- Student and School Summary Report (SSSR): This is a summary used by schools to view cohort performance, identify trends, and plan teaching adjustments.
- Proficiency Standards / Levels: As of reporting reforms starting in 2023, student results are aligned with four proficiency levels: Exceeding, Strong, Developing, and Needs Additional Support.
- Scale Scores & Comparisons: Each domain has a scale score (on a numerical continuum) that indicates the relative difficulty of items correct, and is compared against average performance and the performance of the middle 60 percent of students at that year level.
These reports also display range information (such as quartiles or percentiles) and sometimes item-level data or examples (examples of questions or skills mapped to the test).
How to Read the Proficiency Levels
The shift to proficiency levels is meant to make result interpretation more meaningful. Here’s how you can think about them:
- Exceeding — The student has exceeded expectations for that year level.
- Strong — The student has met expectations (the “challenging but reasonable” standard).
- Developing — The student is approaching expectations but may still need support in certain domain areas.
- Needs Additional Support — The student is below expectations and will benefit from targeted assistance.
These levels give you a clear, qualitative sense of how your child is tracking relative to their expected stage of schooling.
Understanding Scale Scores & Distributions
Beyond the levels, each domain has a scale score, which is more granular. The scale is designed so that more difficult items contribute more to a higher score. Students who answer items of higher complexity correctly will generally score higher, even if they answer the same number of items correctly as a student who attempted easier items.
Reports also show how your child’s score relates to the middle 60 percent of students at the same year level, or the distribution of performance in that domain for their school or class. This contextual data helps you see whether your child is in the middle, above, or below compared to peers.
Box plots, quartiles, and “whiskers” are sometimes used to visualise spread:
- The “box” often represents the middle 50 percent (from 25th to 75th percentile).
- The “whiskers” show the full range (lowest to highest scores).
- A line inside the box marks the median.
If your child is at or above the median, that’s a positive indicator; if they’re well below, it can be a signal to dig deeper.
What the Report Doesn’t Show (and Why That Matters)
It’s important to keep in mind the limitations of any standardised test, including NAPLAN:
- Snapshot, not full picture
The test captures performance on one day and only on selected tasks. Things like fatigue, test anxiety, or illness can influence outcomes. - Not all skills assessed
NAPLAN tests certain literacy and numeracy skills, but doesn’t cover entire curriculum content, broader thinking skills, or creativity. - Margin of error / measurement error
Especially in smaller cohorts, variability is greater. Differences of a few scale points may not be meaningful. - Comparisons over time are limited
Because reporting systems changed in 2023, NAPLAN scale scores before 2023 are not directly comparable to those from 2023 onward. - No full item response detail in some cases
While some reports give item examples or breakdowns, you may not see every question or error your child made.
Because of these boundaries, results should be used as one piece of information among classroom assessments, teacher feedback, and your child’s own reflections.
Book a Free Assessment
What to Look for: Key Signals
When going through the report, here are helpful things to focus on:
- Which proficiency levels your child achieved across domains (e.g. “Strong” in Reading but “Developing” in Numeracy).
- Whether your child is above or below the median / middle 60 percent.
- Consistency (or inconsistency) across domains: is one area lagging behind the others?
- Large gaps between your child’s results and class or school averages.
- Any domains in Needs Additional Support — and by how much they fall short.
- Whether your child answered more complex items correctly (this shows depth, not just breadth).
- Trends (if you have prior years or school data) — although comparability has changed, some trend clues remain valid.
How You and Your Child Can Act on the Results
- Discuss the results openly
Approach the report as a conversation starter, not a verdict. Ask your child:
- Which part felt easier or harder during the test?
- Did time pressure or confusion affect their performance?
- Which questions did they skip or feel unsure about?
- Bring results to conversations with the teacher
Use the report to ask targeted questions:
- How do these results align with classroom assessments?
- What specific skills or question types were problematic?
- What can we do at home to support progress in weaker areas?
- Set focused goals
Instead of trying to “improve everything,” choose 1–2 domains or subskills to improve. For example: “practice algebraic reasoning in numeracy” or “focus on less common punctuation rules in language.” - Use exemplars and resources
Many NAPLAN reports include item examples (questions typical for certain difficulty levels). Review those with your child to see where thinking differs. Schools and educational platforms often provide aligned practice. - Monitor improvement mid-year
Don’t wait until the next NAPLAN to judge progress. Use school assessments, shorter diagnostic tests, or teacher feedback to track how your child is improving. - Celebrate effort and growth
Especially for domains where improvement is slow, recognise persistence and progress rather than only absolute results.
Final Thoughts: Using NAPLAN Reports Wisely
NAPLAN results are valuable but partial. Think of them as an additional lens — not the only one — through which to view your child’s learning journey.
At Dr. Study, we emphasise turning reports into action: decoding what the numbers and levels point to, then using that to create a tailored plan for growth. If you’d like help interpreting your child’s NAPLAN report and designing a strategy for improvement, we’re here to support.
At Dr Study, we offer personalised NAPLAN tutoring in Melbourne for all years:
Our tutoring plans are specifically designed to match each student’s unique learning style and needs to ensure they excel in their NAPLAN exams. Book a free assessment with us today!
